uwc-chart components are used to convey data in an easy to visualize way. The UUX chart component uses the HighCharts library, which requires a licence. Please contact the UUX team before use in your project.The UUX chart component uses the HighCharts library - which requires a license. UUX charts included in a Temenos User Agent may be used in the form originally provided by Temenos. A separate licence from Highsoft AS is required to alter any UUX charts included in a Temenos User Agent or create new charts using the UUX chart component
This powerful library encompasses these chart types and more:
- Column and bar charts
- Line charts
- Area charts
- Pie charts
- Scatter and bubble charts
- Combinations
- Tree maps
- Gauge
- Sunburst
- Sankey diagram
- Calendar heatmap
- X-range series
More details and examples can be found here. If you can find it in the High Charts Core library, it can be provided by configuring the UUX chart component.
The standard behaviour is for the UUX component to be passed a configuration of a chart (without series data) in the config property. Data should be passed as an array to the data property. This can be refreshed, and the chart will redraw itself.
**Note: the UUX chart bundle is separate from the core UUX web bundle. It needs to be loaded in the page (after the core web bundle). This is available to Temenos Employees from the Nexus repo and is not hosted here.
Please get in touch to see the UUX chart component in action. We are unable to provide a live demo on our public website for licensing reasons.
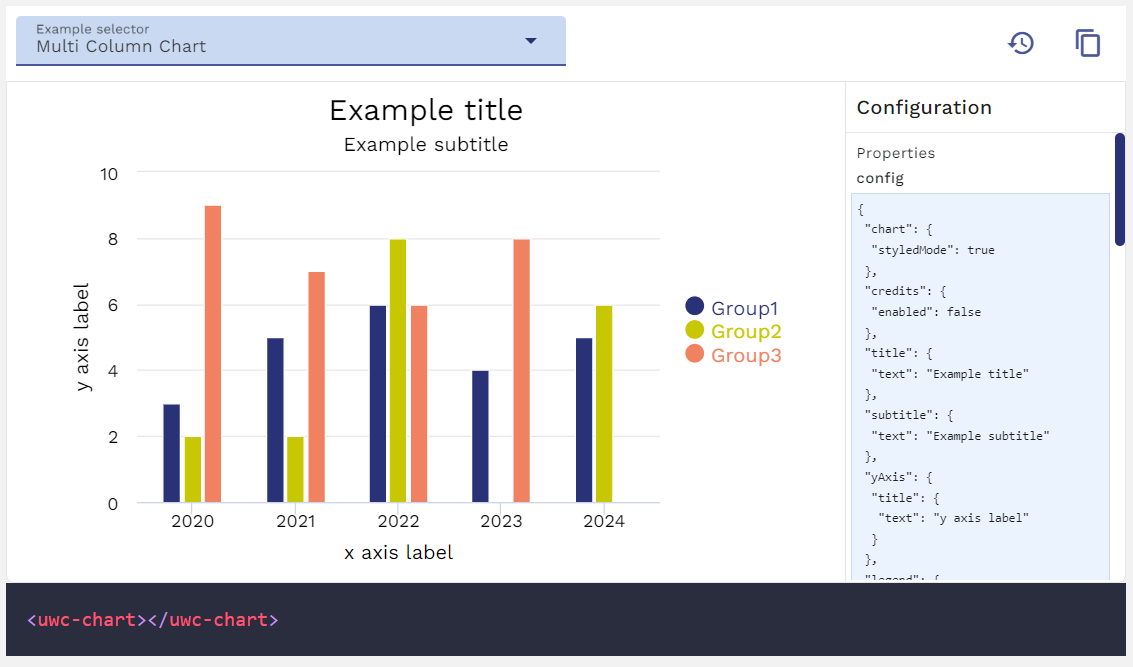

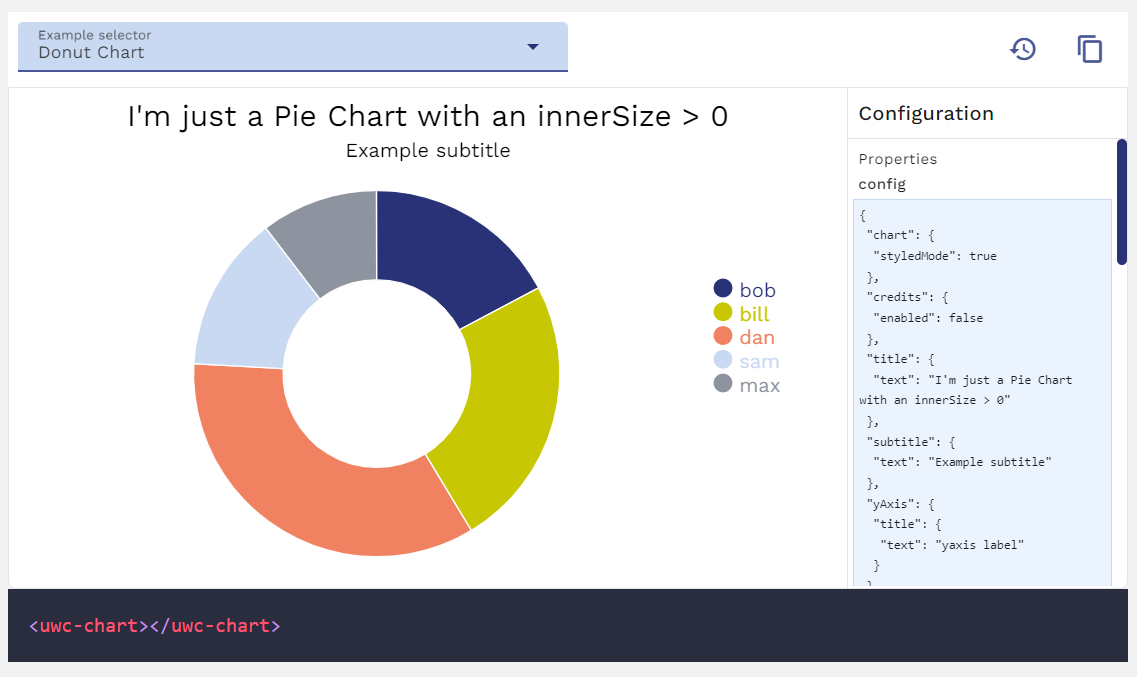
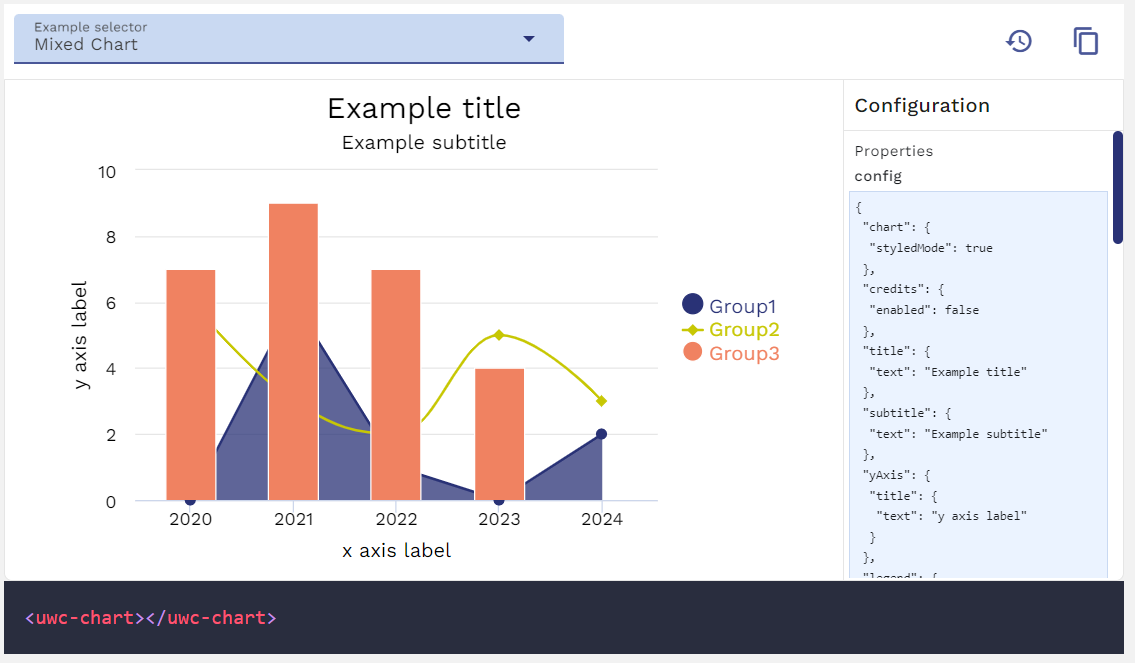
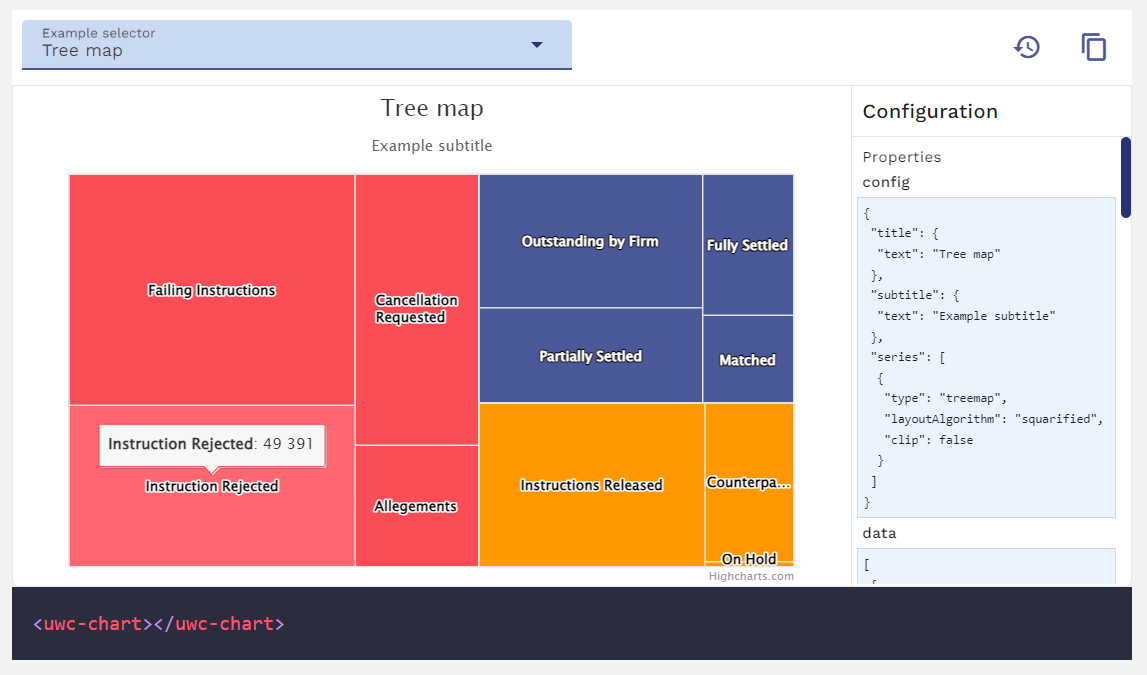
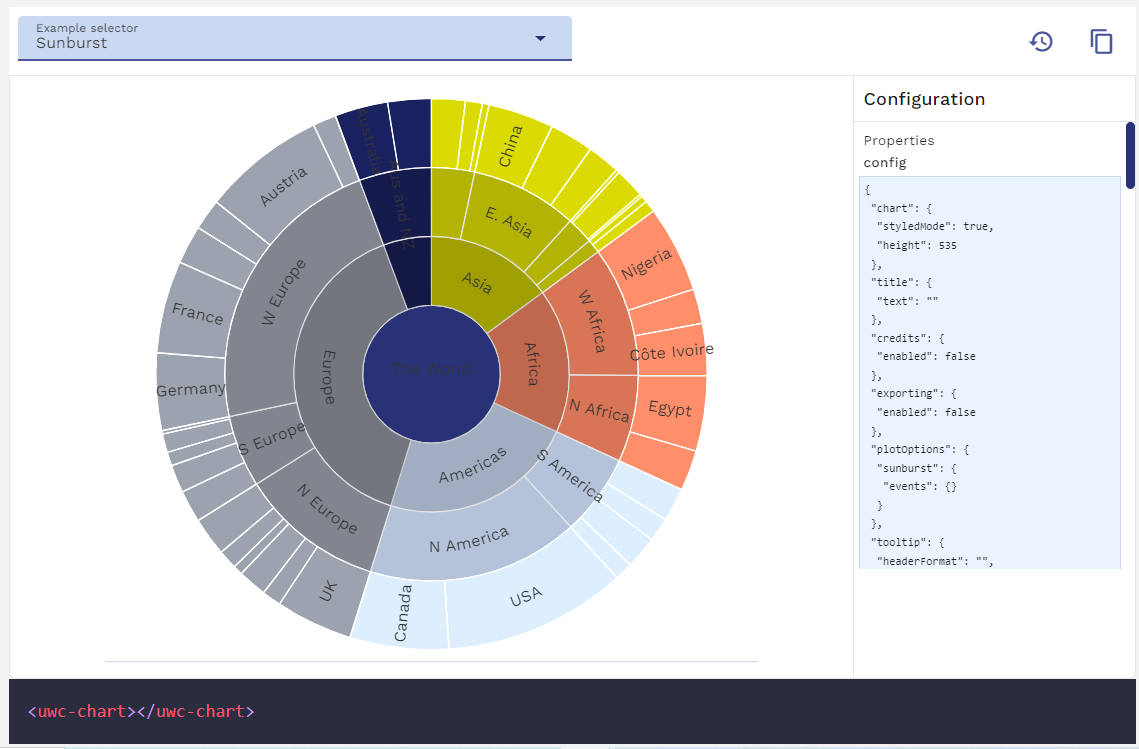
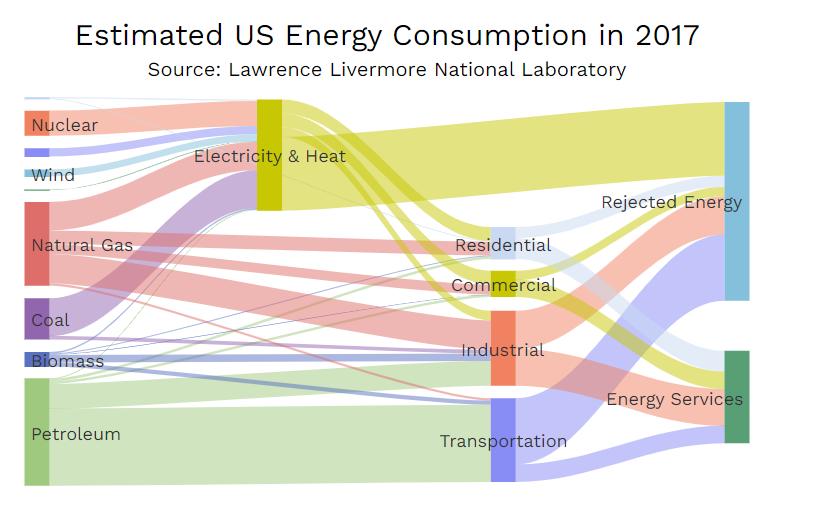
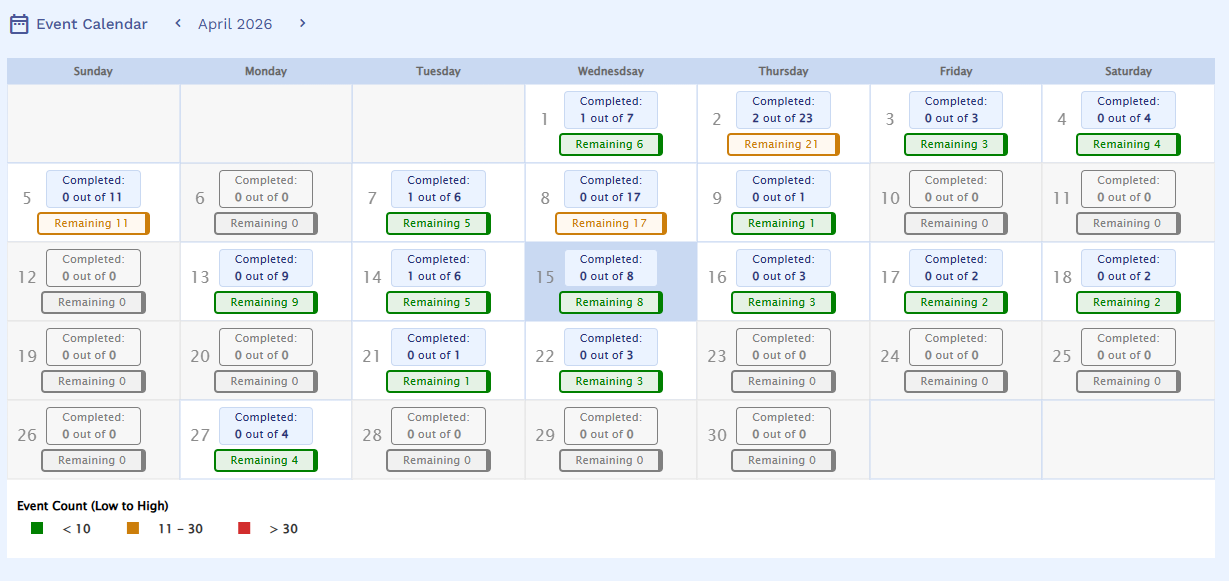
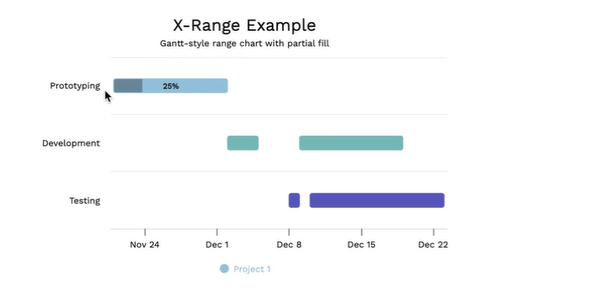
Updating the data will trigger the chart to redraw itself.
Our components have been designed to comply with the WCAG 2.2 AA accessibility guidelines. For more information about how our design system complies with color-related accessibility guidelines, see Foundations > Colors > Accessibility.
The Highcharts accessibility module is pre-bundled and active by default — no additional configuration is required to enable it.
Keyboard navigation: Tab moves focus into the chart; arrow keys then navigate between data points.
Screen reader support: Highcharts generates ARIA attributes and hidden screen reader content automatically. You can enrich this with two configuration options:
Heading hierarchy: Highcharts injects an <h6> before the chart by default. If this breaks your document outline, override it:
The no-data-to-display module is pre-bundled. When all series contain no plottable data, a placeholder message is shown automatically.
The message defaults to "No data to display" and can be customised via config.lang:
The placeholder text colour inherits --uwc-chart-fg and the element can be targeted with the .highcharts-no-data CSS class for further styling.