Dashboard Config
CSA supports multiple dashboards and these are configured in the CSA_config.js file or in the CSA_DASHBOARD_CONFIG environment variable (by reference to that environment variable in CSA_config.js (or see/consider ConfigServlet)) if deployed in a container.
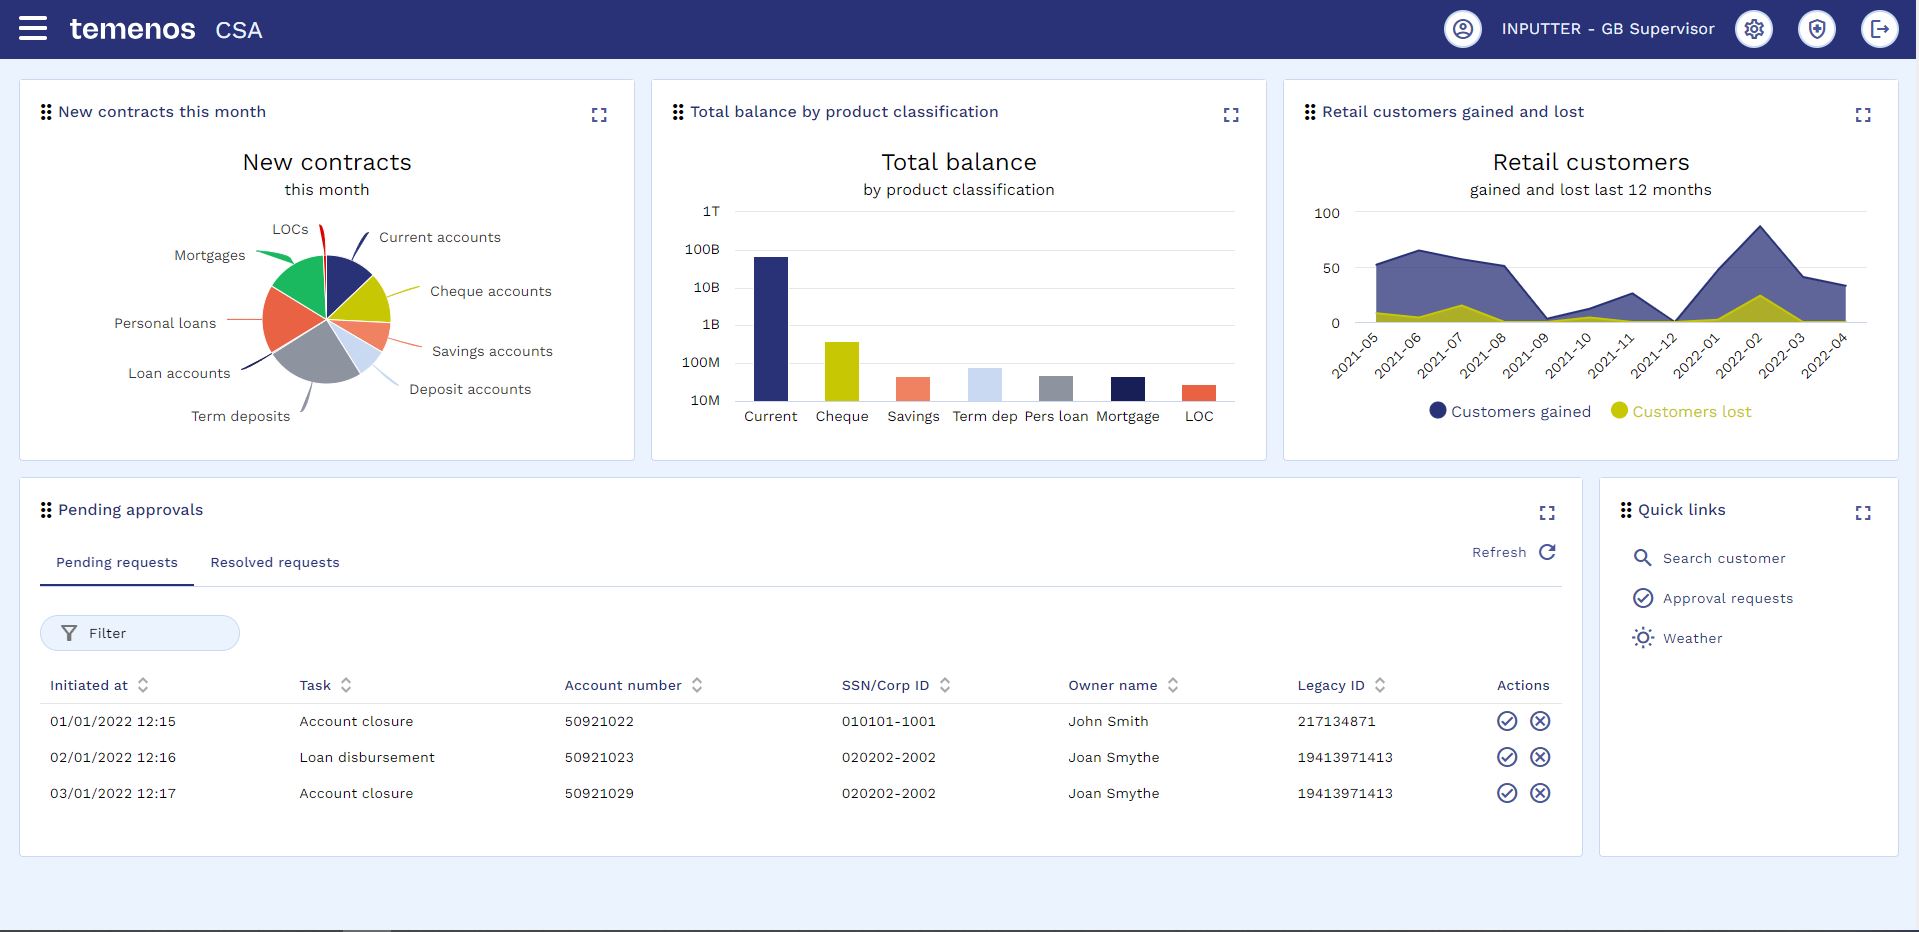
Example dashboard
The value DASHBOARD describes all of the available dashboards as named arrays:
var DASHBOARD = {
    // default dashboard
    default:[
        {
            index:0,
            element:'dashboard-chart',
            width:4,
            cardTitle:'New contracts this month',
            cardMinHeight: '380px',
            drilldownType: 'accountType',
            apiEndpoint:'http://$HOSTNAME$:8085/api/Tenant1/DataQuery/RetailProductsNewThisMonth?$filter=RowOrder%3D1',
            apiMethod:'GET',
            apiPayload:null,
            dataProcessingFunctionNames:['dashboardNewContractsPie'],
            xAxisCategoriesFunctionName:'',

            //further attributes depend on the element type. For a chart these may be...
            chartConfig:{
                config for the chart
            }
            chartData:[
                {
                    name: 'New contracts',
                    type: 'pie',
                    data: [],
                },
            ],
        },
        {
            index:1,
            element:'dashboard-chart',
            width:4,
            cardTitle:'Total balance by product classification',
            apiEndpoint:'http://$HOSTNAME$:8085/api/Tenant1/DataQuery/RetailProducts?$filter=RowOrder%3D1',
            apiMethod:'GET',
            apiPayload:null,
            dataProcessingFunctionNames:['dashboardTotalBalanceSeries1'],
            xAxisCategoriesFunctionName:'dashboardTotalBalanceXAxisCategories',
            highchartsOptions: {lang:{numericSymbols:["k", "M", "B", "T", "q", "Q"],}},
            drilldownType: 'accountType',
        },
    ],

    // secondary dashboard
    secondary_dashboard: [
        {
            ...config for first dashboard card...
        },
        {
            ...config for second dashboard card...
        },
    ],

    // customer analytics dashboard - appears on the customer overview analytics tab
    customer_analytics: [
        {
            ...config for first card...
        },
        {
            ...config for second card...
        },
    ]

};
A specific dashboard definition named "customer_analytics" exists to populate the "Analytics" tab on the customer overview. This should not be used as a general dashboard as its contents will be specific to the current customer being viewed. Presentation is slightly different for this dashboard as it appears inside the customer overview card.
Dashboards are either invoked from a menu option (from TA_menus.js)
{
    "type": "item",
    "label": "menu.Dashboard",
    "actionId": "CSA",
    "querystring": { "page":"dashboard", "dashboard":"default" }
},
or from the role startup information (from TA_permissions.js).
{
    RoleId: "GB_Supervisor",
    RoleDescription: "GB Supervisor",
    Startup: "CSA",
    StartupParameters: { page: "dashboard", dashboard: "default" },
    ...
}
Attributes available to describe each card are as follows:
| Attribute | Example | Mandatory? | Description |
|---|---|---|---|
| index | 0 | mandatory | unique index for card |
| element | 'dashboard-chart' | mandatory | custom element to render - possible values: dashboard-chart, dashboard-table, dashboard-squares, dashboard-links, dashboard-pending-approvals |
| width | 4 | mandatory | width of tile in twelfths of a screen (1-12) |
| cardTitle | 'New contracts' | mandatory | title for dashboard card |
| cardMinHeight | '380px' | optional | minimum height for card |
| drilldownType | 'customer' | optional | type of drilldown to perform if an item within a chart or table is clicked |
| apiEndpoint | 'http://a.com/api1' | optional | API endpoint to retrieve data |
| apiMethod | 'GET' | optional | HTTP Method to use for API call |
| apiPayload | {x:'y'} | optional | Payload to send if using PUT or POST methods |
| predicateApiEndpoint | 'http://a.com/api1' | optional | API endpoint to retrieve predicate data - dashboard-squares,chart only |
| predicateApiMethod | 'GET' | optional | HTTP Method to use for API call - only GET supported - dashboard-squares,chart only |
| predicateApiPayload | {x:'y'} | optional | Payload to send if using PUT or POST methods - dashboard-squares,chart only |
| predicateFunctionName | 'IsHighIncome' | optional | function name that analyses the predicate response and determines if it is appropriate to show the apiEndpoint response (returns boolean) - dashboard-squares,chart only |
| valueArrayAttribute | 'value' | optional | name of the attribute in the response that holds the array of results (usually 'value' for analytics APIs) |
| sortFieldname | 'Dates' | optional | Attribute to sort results by |
| sortDirection | 'DESC' | optional | Sort direction if sortFieldname specified 'ASC' or 'DESC' |
| sortDatatype | 'NUMERIC' | optional | Enable sort to be numeric rather than alphabetic |
| valueFieldnames | ['AvgDriverWeight'] | optional | For dashboard-chart, array of response fieldnames to form the various series for the chart. If not specified, dataProcessingFunctionNames is required |
| labelFieldname | 'DriverNameValue' | optional | For dashboard-chart, Response attribute to use for x-axis labels. If not specified, xAxisCategoriesFunctionName is required |
| dataProcessingFunctionName | 'dashboardCustomersData' | depends on element | window["xxx"] function name to extract data for the element from the API response - e.g for dashboard-squares, dashboard-table or dashboard-links |
| dataProcessingFunctionNames | ['dashboardNewContractsPie'] | depends on element | array of window["xxx"] function names to build each chart series from the API response - e.g. for dashboard-chart |
| xAxisCategoriesFunctionName | 'dashboardNewContractsXAxisCategories' | optional | window["xxx"] function name to extract x-axis categories for a chart from the API response |
| translateLabels | true | optional | Should dashboard-chart labels be translated? Default = false |
| highchartsOptions | { see Highcharts documentation } | dashboard-chart | options that amend highcharts default presentation |
| chartConfig | { see Highcharts documentation } | dashboard-chart | Highcharts chart config |
| chartData | { see Highcharts documentation } | dashboard-chart | Highcharts data config including empty array(s) which will be populated from the API via the processing function |
| linksConfig | {linkColor, linkStyle} | dashboard-links | colour and style for links |
| linksData | {title, icon, plugin, page, url} | dashboard-links | data for links |
| squaresConfig | {gridWidth, titleVariant, titleColor, squareStyle} | dashboard-squares | config for squares presentation |
Custom javascript
Attributes valueFieldnames and labelFieldname define the name of the response within the valueArrayAttribute array if the chart is based on simple data that can be extracted without any processing or adjustment.
Alternatiely, attributes dataProcessingFunctionName, dataProcessingFunctionNames and xAxisCategoriesFunctionName define the name of functions, attached to the window object, to be used to process the API response so that it is in a format acceptable to the Highcharts data attribute.
These functions need to be defined either in the CSA customisation.js or held in the Generic Config Micro Service from the CUSTOMJSURL setting.
Example functions follow:
/**
 * Dashboard - Product count chart - series 1 - API to chart series array converter function
 * @param {*} data
 * @returns array of numbers
 */
window["dashboardProductCountSeries1"] = (data) => {
    let result = [];
    try {
        result = data.value.map((record) => {
            return record.ProductCount;
        });
    } catch(err) {console.log(err);}
    return result;
};

/**
 * Dashboard - Product count chart - x axis - API to chart x-axis labels converter function
 * @param {*} data
 * @returns array of labels
 */
window["dashboardProductCountXAxisCategories"] = (data) => {
    let result = [];
    try {
        result = data.value.map((record) => {
            return record.NextBestProduct;
        });
    } catch(err) {console.log(err);}
    return result;
};
Licence warning
Temenos are licenced globally to create and distribute Highcharts definitions for the dashboard-chart element. If a customer wishes to define their own charts they will have to obtain their own licence from Highcharts.